emissions Hog Farms photos,
Pulp mill photos, Rendering Plants,50% Honeybee Disease photos, US EPA
Coal Combuster photos
EMISSION ID/PREMEASUREMENT
&
CONTROL REDUCTION TESTS BEFORE& AFTER-photos below
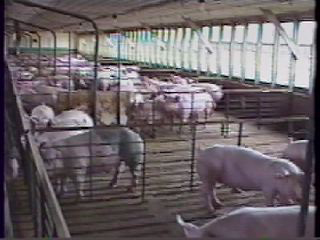
Live
Animal Producers (hog/cattle/poultry) 1500-3500ppb of
ammonia/hydrogen sulfide/PM10 odor TO 13-14 ppb,
Pulp Mills - hydrogen sulfide/methyl mercaptan odor etc premeasured at
400-2500ppb TO 6ppb,
Rendering Plants -ammonia/methyl mercaptan odor measured at
600-1500ppb,
Mysterious Honeybee 50% Losses in Fall Dwindle Disease
TESTED HONEYBEES DEAD & HEALTHY OF PENN STATE WEBSITE photos
TO DETERMINE
DEATH CAUSE OF BEES "COLONY COLLAPSE DISORDER".
honeybee1.htm
We calculate control units
needed to reduce each CO, CO2, SO2, Nox, VOC, PM10/2.5 and
Mercury Air
Emissions at following levels: 4, 40, 400, 4,000, 40,000
and 400,000 TONS PER YEAR.
From 1996 to 2003, we tested our control equipment by visually
observing the air emission reductions at
power plants, forest fire
smoke
plumes, pulp mill and live animal sites.
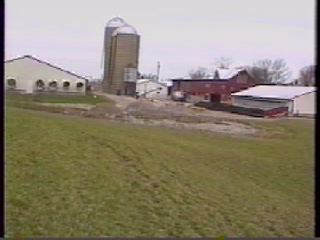
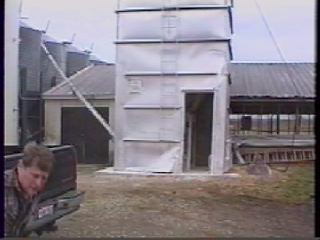
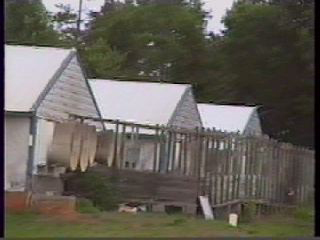
March 25
& 26, 2004 Hog
farm test-Ohio
Ohio Pork Association Executive Director Dick Isler
(614-882-5887)
arranged an Ohio Hog producer Bill Ringler
to have us install our
control equipment
at two 5000
and 7000
hog farm sites about five miles apart for 17 hour test.
Hog SMELL
adds Hydrogen Sulfide 1500-3500 ppb. PulpSmell is Methyl
Mercaptan, Dimethyl Sulfide,
Phenols & Dimethyl Disulfide at
1-300ppb. We
eliminated these SMELLs and lowered ppb odor in 17 hours at each site.
On March 25 at 4pm, Air emission at 5000 hog farm (two10MM
gallon) lagoons measured 2711 ppb ammonia
& 3155 ppb hydrogen
sulfide.
At
7000 hog farm (two15MM gallon) lagoons, air was 3101ppb ammonia
&
3210 ppb hydrogen sulfide.
On March 26 at 8:30 am, Air emission measured at 5000 hog was down
to126 ppb
ammonia and 132 ppb
hydrogen sulfide but NO SMELL/NO ODOR and at 7000
hog farm at 9:30am measured 220 ppb ammonia
and 192 ppb hydrogen
sulfide.
Our 92-95% reduction in 17
hrs was excellent but we improved by adding secondary outside unit on
next confirmed tests.
We can do tests using Ultra Violet measurement when available to
confirm hydrogen sulfide measurements
and/or FTIR for ammonia
measurements to compare to our proprietary measurements.
A before measurements
of ammonia & hydrogen sulfide are typically
500 to 3000 ppb per
USDA & US EPA.This smell desensitizes
nasal passages & these
compounds rust
metal.
Power plants air emissions include Sulfur Dioxide(SO2)
{800-2500ppm},
Nitrogen Oxide (NOX){100-500ppm},
Carbon Monoxide
(CO){2.25ppm}, Particulate
Matter-10 micron (PM10){1.5-2.0ppm}, Particulate
Matter 2.5
micron (PM2.5) {1-2.0ppm}, Volatile Organic Compound
(VOC){NA},
Ammonia{NA} and
Hydrogen Sulfide{NA}.
We did test observations at western US power plants in
2001-03, western state forest fires, North Carolina
pulp mill in 2003
and test labs. We saw cleaner air in one to three days, NO ROTTEN EGG
SMELL
(hydrogen sulfide) & better environment.
To confirm our visual tests, we developed a proprietary measurement
capability & worked with US EPA
who implemented use of Open Path
FTIR
(fournier transformer infrared) spectrograph photos in
two or
three dimensional illustration to verify SO2, NOX, CO, PM2.5,
PM10,
VOC
and
Ammonia and Hydrogen
Sulfide with UltraViolet combination. We do
work with associations, private companies & consumers.
We
ID/PREmeasure air emissions & determine control units needed per
site.
We did tests to observe and video tape FTIR test measurments
at hog farms, pulp mills, power plants
and tested
pilot plants for fossil fuels when equipment was available or used our
proprietary measurement
method with still photos attached here.
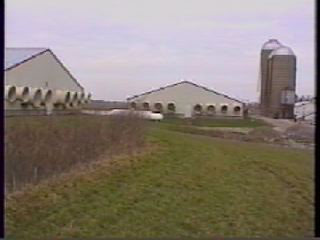
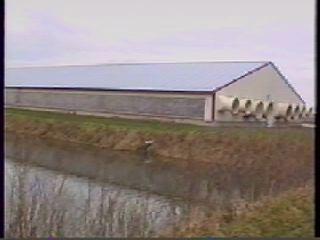
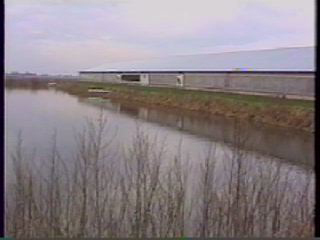
NC HOG
FARM-June 13/14,2004-99.4% reduction ammonia & hydrogen sulfide
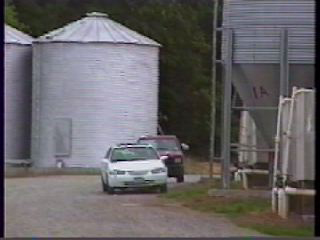
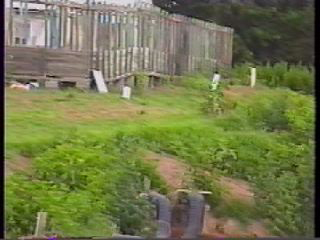
On June 13-18, 2004 week, we tested air emissions at
Asheboro,
NC Hog Farm. Farm has 770 hogs in
each of 11 houses & three large
lagoons. The tests show
2221 ppb of ammonia & 2242 ppb of hydrogen
ulfide on June
13,
2004 at 3pm.
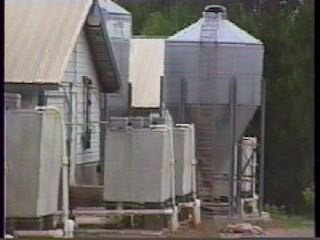
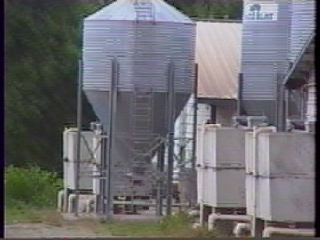
We installed one primary control inside unit in office area and one
secondary
unit outside office. At 9
am
on June 14, 2004, the measurements were 13 ppb of ammonia and 14 ppb
of hydrogen sulfide but
no detectable smell or odor to tester.
We appreciate and thank Mr Roy & JoAnn
Chriscoe owners for their
cooperation to
offer their facilities for testing.
NC PULP
MILL-June 14/15,2004-98.6% reduction hydrogen sulfide
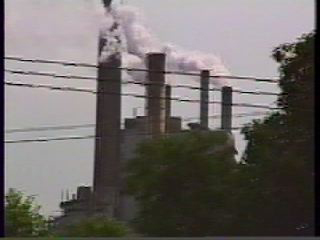
On June 14, 2004 in Roanoke Rapids, NC at 5 pm, we tested
hydrogen
sulfide air emission of pulp mill
at two offsite locations. The
first
location was 500 yards south of pulp mill stack at local Faith
Tabernacle
Church on Washington Street Extension and measured 422 ppb
of
hydrogen
sulfide. The church deacon
Eugene Parks advised us his car had
rusted out from hydrogen sulfide in air but car motor functioned very
well.
We
installed
one primary unit in church meeting room facing pulp mill. The second
location was one mile north
of pulp mill stack at Mr Mead residence on
Ray
Street in Gaston, NC & measured 1323 ppb of hydrogen sulfide.
Mr
Mead advised us this was not the worst bad-smell day. We installed one
primary unit in his home facing pulp
mill.
An outside unit was placed behind his home for secondary
clearing. We PREmeasured control units needed.
At 9 am on June 15, 2004, the results at both church 500 yards south of
pulp mill stack
and
residence one mile
north were six (6) ppb of hydrogen sulfide and
a .75" rainfall per City Planner.
Hydrogen
sulfide was reduced
by 98.6% to 99.3%.
We appreciate Pastor Charles Arnold and Deacon Eugene Parks of Faith
Tabernacle Church in Roanoke Rapids, NC
nd Mr Mead of Gaston, NC for
their cooperation and confidence in providing their facilities to
ID/measure air emissions
nd install our equipment to reduce air emissions of
Pulp Mill in
Roanoke Rapids, NC.
We
thank pulp mill owner environmental staff at International Paper for
reviewing data
results of our reducing air
emissions below the 120 ppb hydrogen sulfide air emission as a proposed
requirement by NC regulations.
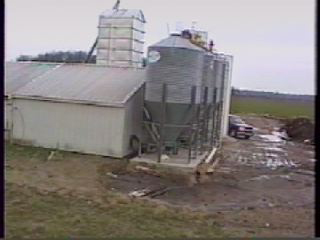
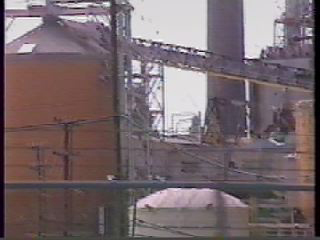
US EPA
TEST COAL COMBUSTOR EMISSIONS


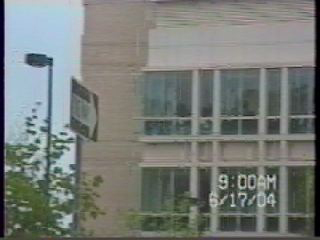
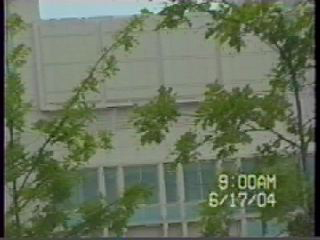
On June 16, 2004 at US EPA test site in Research Triangle Park,
NC at 8
am, we observed US
EPA
contractor testing new coal combustor using natural gas to heat to
2000 F for two hours. At 10 am,
contractor switched to pulverized
bituminous coal with 18% ash and 1.5% sulfur for shake out tests.
The combustor was rated at 4 million BTU/hour using either 333 pounds
per hour of 12,000 BTU coal
or 28.8 gallons of
fuel oil or 3,840 standard cubic feet per hour of 1020 BTU natural
gas.
They operated
at 50% of capacity but still had 4000+ cubic feet per
minute of air through combustor and 1000 cubic feet
per minute flue gas
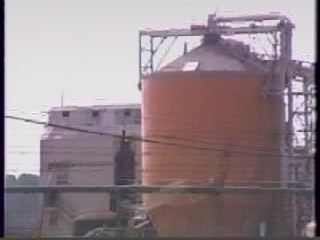
flows thru stack. The combustor system had surge
bin hopper with four hours of coal,
screw and gravity conveyor and air
flow delivery back to top of 40+ foot combustor. The flue gas
flow
was
to three heat exchangers, one bag house and one wet
scrubber with limit of 150F exit emission stack gases.
Most
plants are 270F+ without wet scrubber. EPA Contractor confirmed
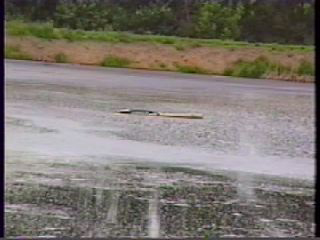
.16"+ rain in 17 hrs as with lower emissions.
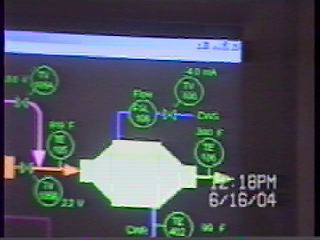
The US EPA had no continuous monitors attached to any portals of
combustor yet. They used a FTIR-open path
with passive mode to
measure
stack's heated exit emissions. It was to provide a clear
resolution of
infrared
measurements if temperature exit stack gases are at least 270F
but assured us they could give us
measurement
f at 150F per EPA staff person.
Our objective was to confirm our proprietary test measurements compared
with EPA's FTIR and reduce air
emissions level of flue gases. We
did measurements for Sulfur Dioxide, Carbon
Monoxide, Carbon Dioxide,
Nitrogen Oxide, Particulate Matter 10 micron,
Mercury, Hydrogen Sulfide to check US EPA. We await results
of
coal emissions by
US
EPA FTIR collected.
SUMMARY
We conclude the Hog Farms and Pulp Mill air emissions reduced an
average 5-6% an hour
during first 17 hours
with one or two primary units & secondary
unit as PREmeasured. EPA combustor plugged with ash/clinker
after 3.5 hours & operated 45-50 minutes after we activated our
primary units. It was
long enough to see same
consistent hourly reduced air emissions.
ICT
control
units
do
not emit any measurable radiation signal & are safe per David
Proffitt and
Ed
Brown of Arcadis-US EPA prime contractors & operators who stated
"your control
equipment
can
not interfere
with combustor operation". Large plants CO2 reductions are 47.1% in +
50.1% outside stack at 42 ft where backround level starts.
TEST
RESULTS
After 45 minutes, we had percentage reductions based on actual
measurements and projected reductions after17 hours as
follows:
after 45 minutes
reduction
% after 17 hrs projected
SO2 sulfur dioxide
-14%
-97.5%
CO carbon
monoxide
-26%
-97.6%
CO2 carbon dioxide
-46%
-97.6%
PM10 particulate matter 10 micron
-20%
-60% BAG house has low emissions.
Nox Nitrogen Oxide
-19.6%
-96%
Mercury
-13.7%
-90%
Hydrogen Sulfide
-10.9%
-98.3%
Each coal, oil, natural gas or other process will require one or more
primary units and secondary units based on
cubic feet per minute of
their air emission flows. The flue gas flows range may be 100 to
2,000,000 cubic feet per minute.
We are doing test using flue gases in static cell to confirm our test
measurements.
We thank US EPA at Research Triangle Park, NC for their
cooperation in helping us review, monitor and pretest
heir combustor
before and after use of our control equipment and
compare their state of art FTIR measurement
equipment to our
proprietary measurement method. A
special thanks to Mr.
Robert Hall, Mr. Shannon Senne,
Mr. Bruce Harris, Mr.Harris's
assistant, combustor
contractor employees Mr. Ed Brown and Mr. David Proffitt.
POWER
PLANTS-COAL/GAS/OIL/HYDRO
We can reduce air emissions of power plants using coal, gas or oil as
performed at US EPA coal, gas & oil plant.
See details.
HYDRO
POWER
PLANTS watersheds are 360 to 1800 square miles MUST lower
charged
air particle
density/lower fugitive air emissions to obtain normal
rainfall of .20" to.75"+ a day to improve and maintain a
onstant CFS
flow rate with head pressure to drive hydro turbines and generate
electricity. Most hydro has
100% water flow in spring
March/April/May & in fall Nov with snow melt & rainfall but
UNreasonable rainfall
June/July/Aug/Sept/Oct and Dec/Jan/Feb from
higher air pollution/ charged particle density to obtain only
38%
annual
operating rate unless water storage available.
SUGGEST HYDROs LOWER CHARGED AIR PARTICLE DENSITY/AIR
POLLUTANTS in MAY-
OCT to provide WATER for HYDRO to STORE &
OPERATE at HIGHER CAPACITY in MAY-OCT &
NOV/DEC/JAN/FEB/MAR.
You are invited to review this web page as updated
and you may contact ICT at ict4help@yahoo.com
information contained in this website is copyright and may not be used
without the express permission of ICT 2004